

The story
One of our partners asked me how to estimate the indicator (KPI) that will tell us simply about return on money invested in Customer Care Department. “Why don’t you just shut it off, wait a week and then calculate losses and lost opportunities?”- I’ve replied. Funny idea. However…
The challenge
In this case Customer Care took had two main functions – telesales and aftersales support. The telesales case was rather simple to calculate when it comes to ROI. About the after-sales we knew only total monthly costs at this time. Our partner wanted to have a simple overview for the executives about ROI in this area.
The idea
We started to brainstorm on how to provide “value” of Customer Care that might be shown in money to confront it with the known costs. The main idea we came up with was to link quality of service with income. We’ve decided to focus on two metrics-Customers Satisfaction (CSAT) and Customer Lifetime Value (how to calculate CLV is a long story itself).
Luckily, CSAT has already been measured by our partner, regularly, for quite a long time ( per transaction and quarterly ).
So that was a well-calibrated metric we could rely on…
The math
Let’s get through our calculations… They are simplified to give you an overview of the idea, as they were much more complex in real life, so:
- Together with business analysts we estimated value of an Customer at $200 per year
- Active customers portfolio was 85 000 at the time
- Customer Care Department cost (in total with overheads) was $4,3 M per year
The structure of CSAT results was (rolled data, 3 months frame):
- (VS) Very Satisfied – 32%
- (S) Satisfied – 30%
- (N) Neutral – 16%
- (NS) Not Satisfied – 10%
- (VU) Very Unhappy – 12%
Our research showed that only customers with highest score (VS) will always buy again and those Satisfied (S) only in 60% of the cases. The weighted chance of buying again was VS + 60%*S = 50%.
The total value of the customers was $17 M (85 k * $200).
As a penalty for bad experience we took those with (VU) rating-12%. Thus, the metric for Buy Again Customer (BAC) was 38% (50%-12%).
The bottom line
So, Customer Care Department gave us a value of 38% * $17M = $6,46 M. We took this one against the costs and got 6,46 / 4,3 = 1,50. So the metric for us was +50%.
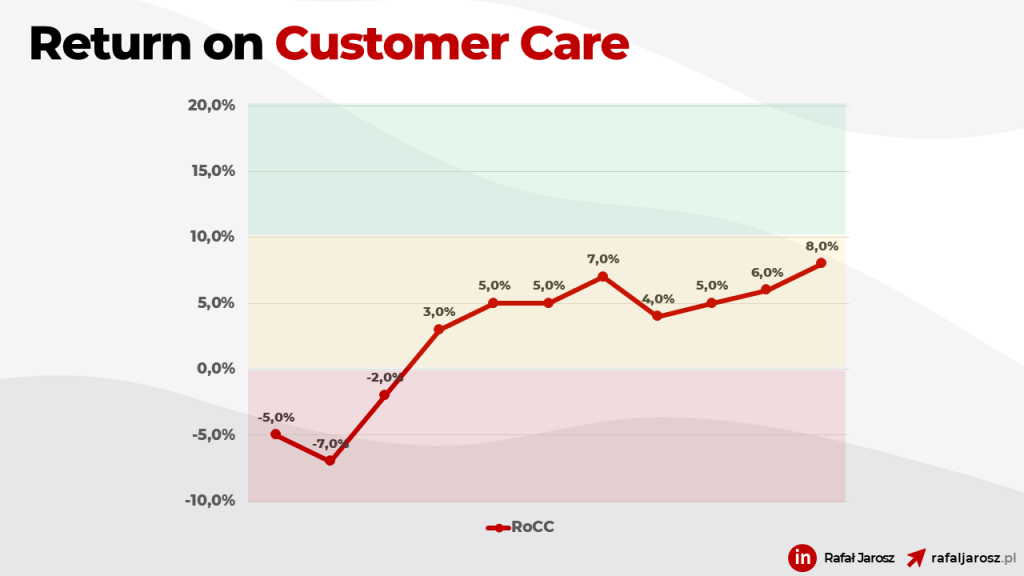
The next step was to analyze and set the desired goals for this value and reliability of measurement. Afterwards this metric became a part of an Executive Dashboard which widget looked something like this (recalculated every month):
The end?
This is only an example of a possible solution – not a perfect one, but simple and easy enough to implement. And what’s most important-it worked for our partner.